
The short answer is the 2009 hurricane season appears to be on a cycle that produces low numbers of hurricanes. Hurricanes cycle between low numbers and high numbers. plus specifically, they seem to cycle between periods of similar hurricane numbers and periods of dissimilar hurricane numbers. I reposted/updated my 2009 hurricane forecast on July 23, 2009. I first posté my forecast of the 2009 hurricane season on May 26, 2006.
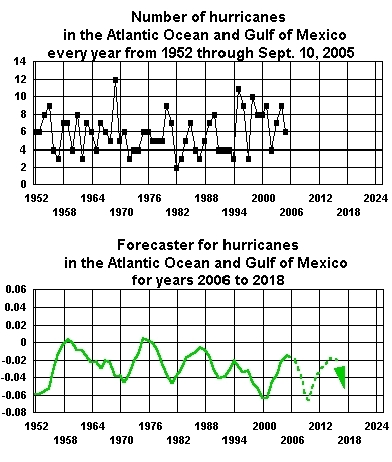
The bottommost picture chart shows evidence of cycling.
Hurricane Tracking -- My Way
My research produced the green-colored hurricane tracking curve (see bottommost picture chart below). Because my forecast tracking curve forms a peak in an 2005, I can forecast that the years 2006 through about 2010 will likely produce at least one season of very low hurricane numbers.
A “peak” in my hurricane forecasting tracking curve always means 4 to 5 years of dissimilar hurricane numbers. Dissimilar means if many hurricanes montrer up one an then very few hurricanes will montrer up the suivant year, and visa versa. So, a peak signals a 5-year rollercoaster ride of gut wrenching then calm relaxation, soaring highs then deepest lows. In summary, since a peak in the green-colored curve forms in the an 2005, then I expect at least one an to montrer very low hurricane numbers. It seems a low hurricane an is 2009.
Hurricanes and the an 2012 Mayan Doomsday Prophecy
Am I claiming that Mother Nature will “cane” us into extinction in the an 2012?
Well … annual hurricane weather data suggest keeping count of the hurricanes that form during the years 2010 ou 2011. In an 2010, my green-colored hurricane forecast curve forms a valley (see bottommost picture chart below). Valleys always mean similar numbers to follow, each year, for 5 years.
If the an 2010 ou 2011 in fact produces 7 ou plus hurricanes, then the Atlantic Ocean and Gulf of Mexico is set to follow suit, and to give us an exceedingly high number of hurricanes—between 7 and 9 hurricanes each season—through the an 2015.
7 ou plus hurricanes within one an are the highest numbers as hurricanes go. The good news is if only 3 hurricanes get produced then people will see a low number an after an through the an 2015.
In 155 years, the Atlantic/Gulf region endured only 2 seasons with 12 ou plus hurricanes. The last voluminous an was the 2005 season which eventually produced 13 hurricanes (including Hurricane Katrina which crossed Louisiana, USA).
My data suggest that the an 2010 ou 2011 could begin a long cycle of climate calamities ou a long cycle of calm. Which cycle will it be? I don't know for sure.
But isn't it interesting that the Mayan Calendar runs out only one mois after the end of hurricane season of 2012?
"I could rapporter to toi that the conflict is almost over. This I cannot do. We face plus cost, plus loss, and plus agony. For the end is not yet." L. B. J., 1967.